
TomoAnalysis™
Unleash the Full Potential of Holotomography
Tomocube’s TomoAnalysis offers advanced capabilities for the visualization and analysis of refractive index(RI) tomograms down to the cellular and subcellular levels. Through a combination of different segmentation strategies and AI-driven deep learning models, the software provides precise quantification results of important parameters such as volume, surface area, sphericity, aspect ratio, and RI concentration of the regions of interest, facilitating a comprehensive understanding of the specimen properties.
With a range of customizable analysis pipeline procedures designed to address diverse user needs, researchers can refine their multimodal image data, extract meaningful measurements, and conduct in-depth quantitative analyses.
Features
User benefits
-

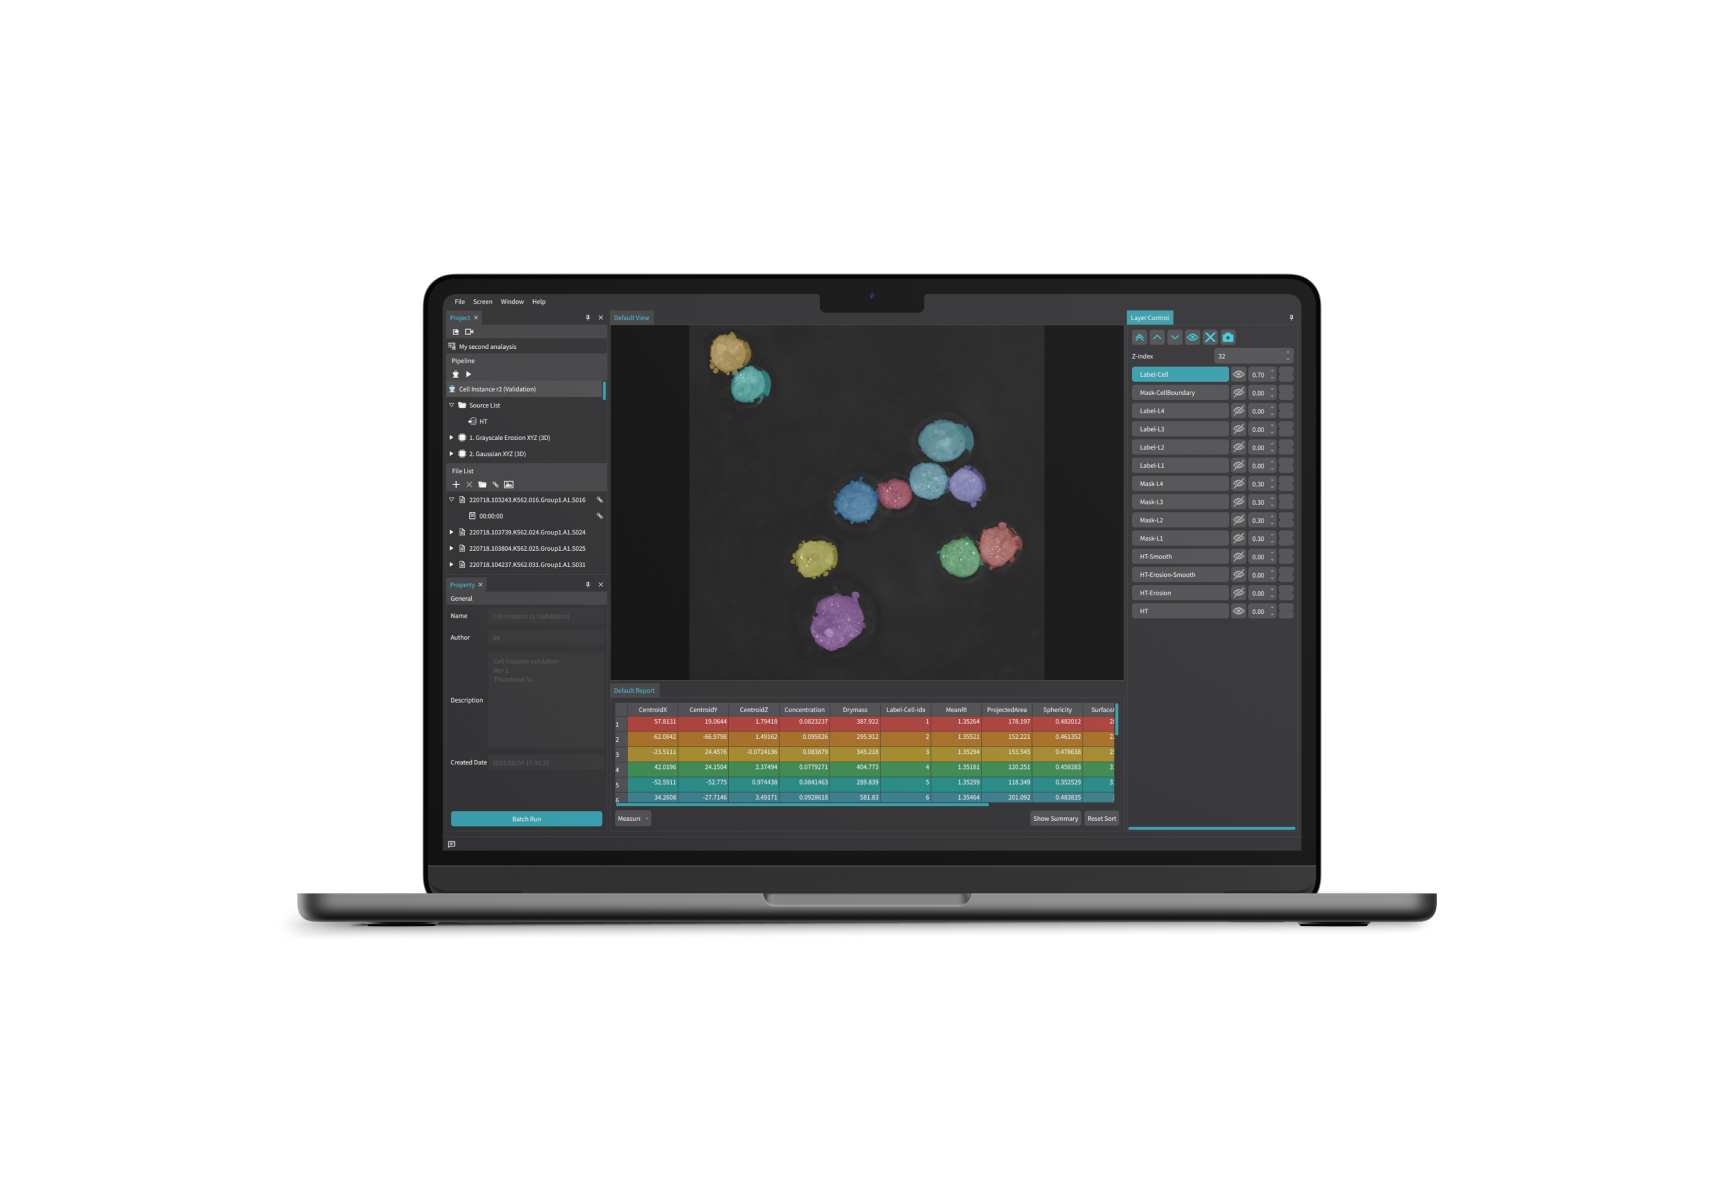
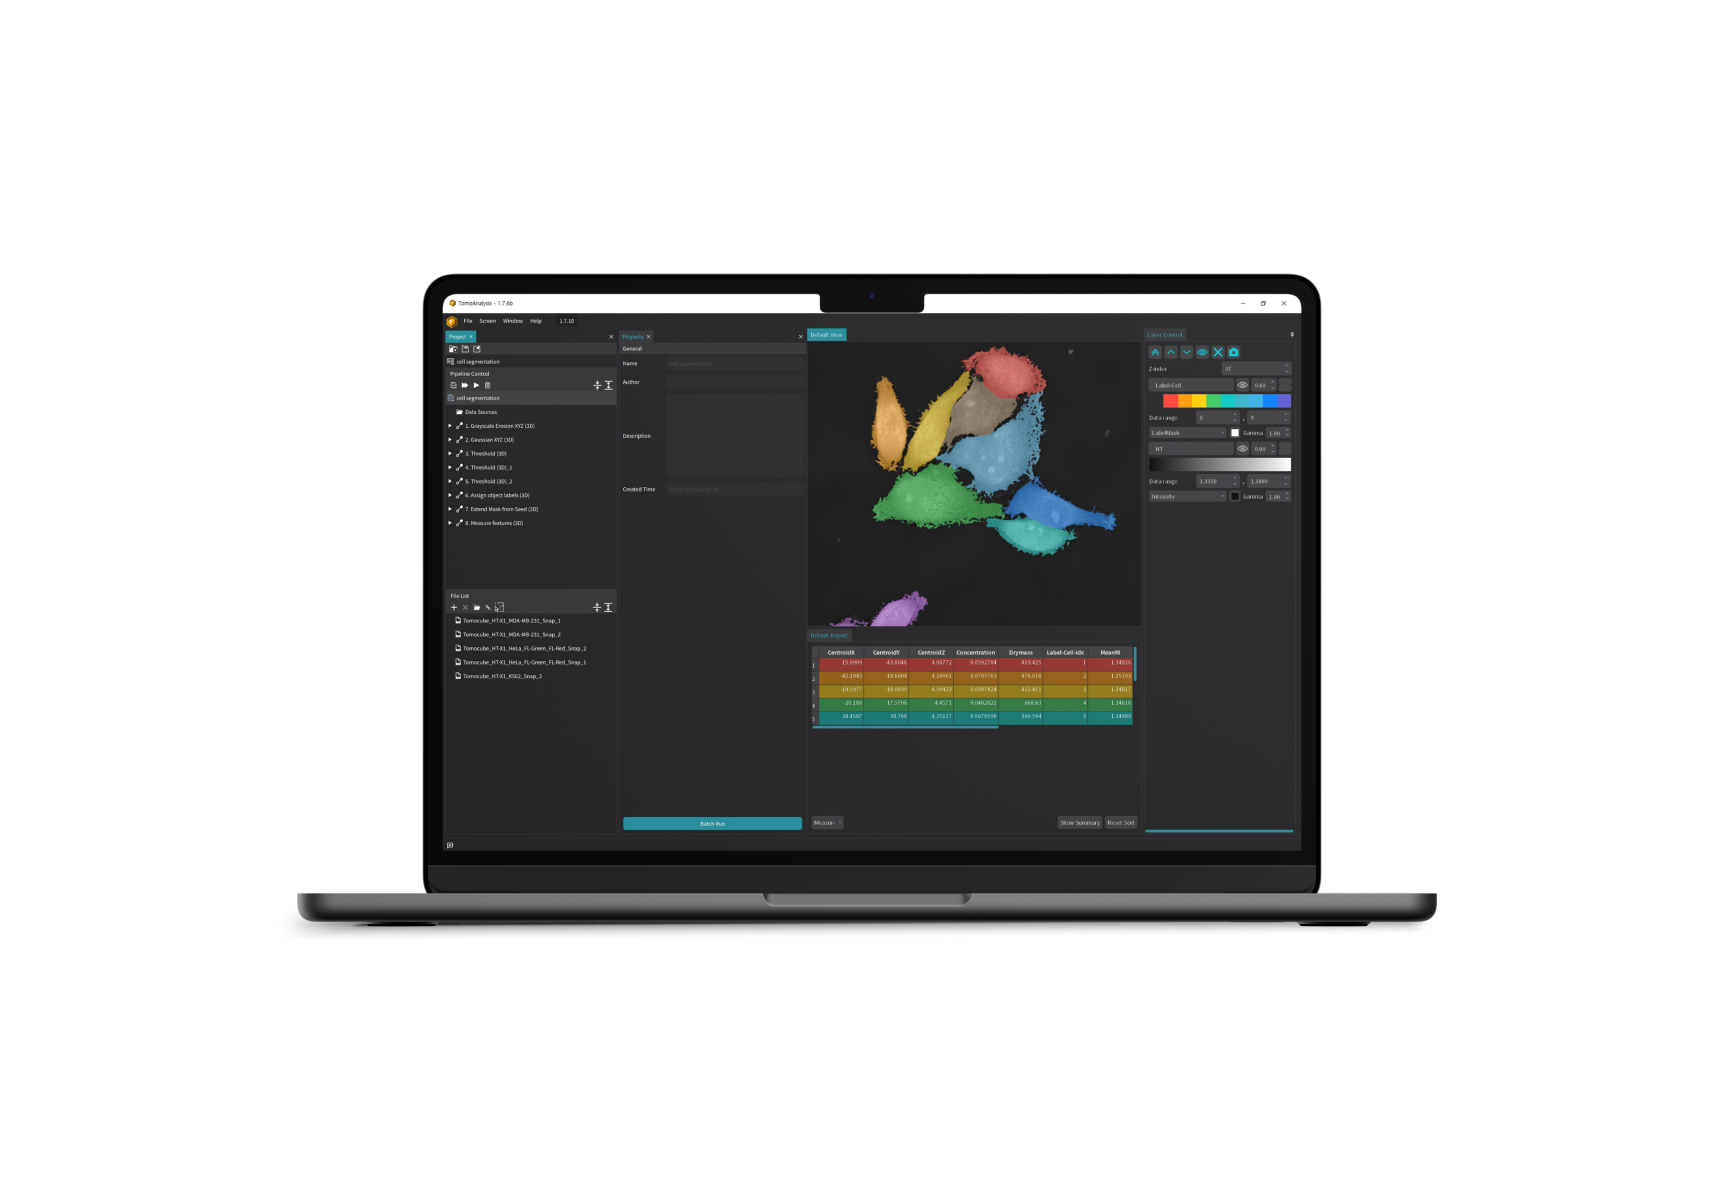
- Cell Instance Segmentation
- The segmentation of cells is a fundamental step in many cell-based biomedical studies due to its pivotal role in extracting meaningful information from complex biological images. Through a combination of different segmentation strategies, including manual thresholding, watershed, region-growing techniques, and AI-based segmentation tools using deep learning algorithms, a streamlined workflow by TomoAnalysis enables researchers to achieve accurate and quick 3D cell segmentation for further measurement and monitoring. Cell instance segmentation in TomoAnalysis allows for precise quantification of cellular features such as size, shape, volume, concentration, and spatial distribution. This quantitative data then provides insights into cellular morphology, facilitating the characterization of cellular physiology and pathological states. Furthermore, versatile cell segmentation workflow can be extended to track and analyze cellular processes over time, such as cell division, migration, and differentiation.
-

- Lipid Droplet Quantification
- Lipid droplets (LD) are independent organelles involved in multifaceted cellular functions and phenomena. Subcellular LD detection and monitoring are critical in the investigation of many lipid-related cellular functions, disease mechanisms, and therapeutic strategies. TomoAnalysis emerges as the ultimate solution for lipid analysis, seamlessly complementing the capabilities of Holotomography (HT). By harnessing the label-free, high-resolution, and non-invasive imaging information that the HT system delivers, TomoAnalysis offers comprehensive quantitative analysis of the lipid content within the living cells. Through an automated segmentation and quantification workflow in TomoAnalysis, researchers can gain invaluable insights into the dynamic nature of lipid metabolism through important biophysical parameters, such as the volume, mean RI, dry mass, and projected areas of individual droplets, with precisionand efficiency. A holistic approach integrating morphological, functional, and quantitative data of lipid droplet dynamics constructs a comprehensive narrative of cellular lipid profile.
-
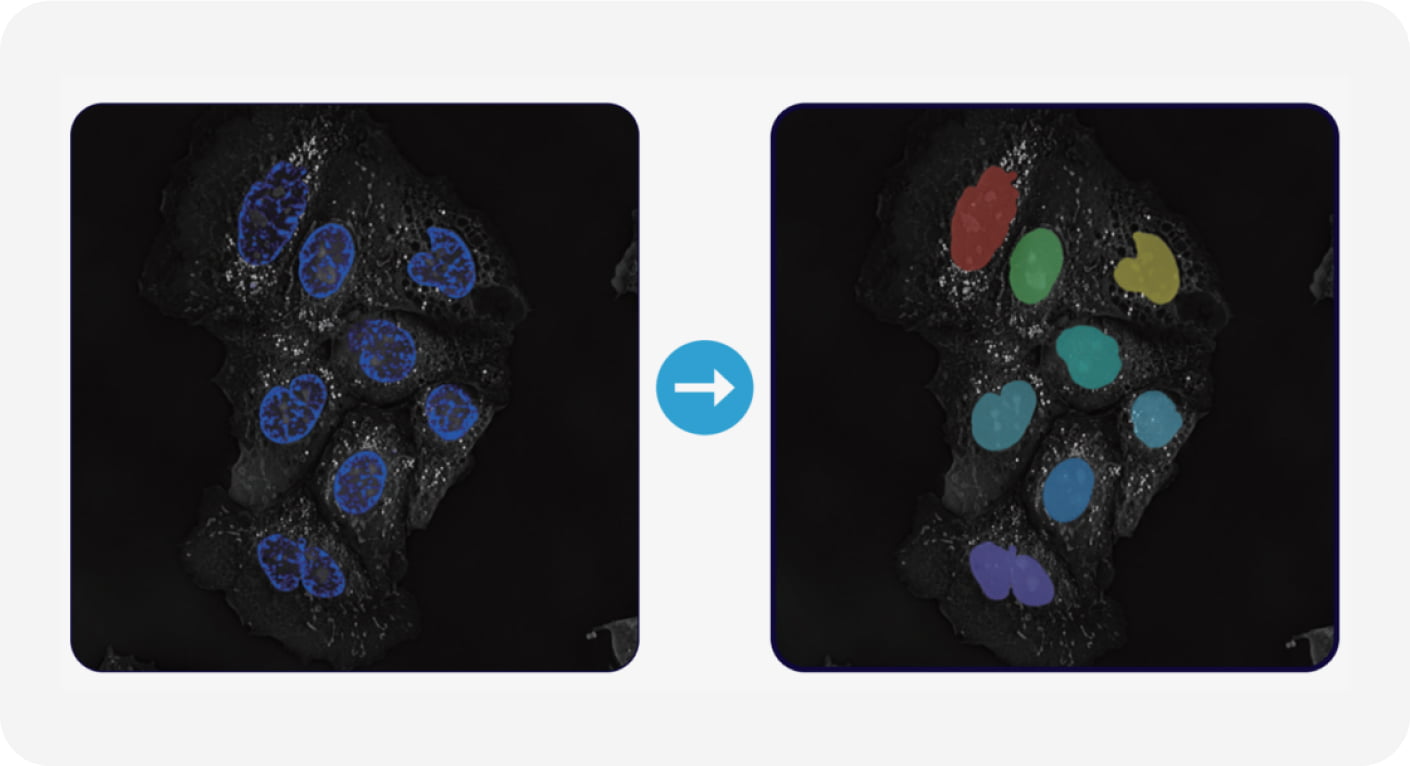
- Fluorescence-based Analysis
- Co-visualization and correlative data analysis of Holotomography and fluorescence signal allow real-time, multimodal observation of multiple cellular processes, enabling measurement strategies to reduce unwanted effects of phototoxicity or photobleaching. Its versatility, sensitivity, and specificity make TomoAnalysis an indispensable tool for various biological and biomedical applications. Fluorescence-based segmentation facilitates quantitative analysis of fluorescence signals, including measurement of fluorescence intensity, colocalization analysis, and spatial distribution of labeled cellular components such as nuclei, nucleoli, or mitochondria. The quantitative analysis enables researchers to extract meaningful data, compare experimental conditions, and derive quantitative measurements of cellular phenomena. While the FL signal is useful in identifying targeted parts of the cell, it does not precisely reflect the physical information of the targets. Meanwhile, HT data provides accurate biophysical information on individual cells and their subcellular organelles. With TomoAnalysis, a synergistic analysis of HT and FL information acquired by the HT-X1 Holotomography system can report the physical information of the specific targets in cells.
-
- Customizable Pipeline and Automated Batch Analysis
- TomoAnalysis offers a flexible workflow consisting of custom analysis modules that can adapt to a variety of situations, from standard analysis algorithms to AI model integration pipelines. The flexible workflow enables users to configure a personalized analysis pipeline tailored to their research needs. The software is designed to meet the analysis needs for comparative studies of multiple data sets acquired by multi-well and multi-point measurement scenarios in time-lapse imaging experiments. Software optimized for users to analyze multiple samples simultaneously reduces the time required for analysis.