
TomoAnalysis™
Unleash the Full Potential of Holotomography
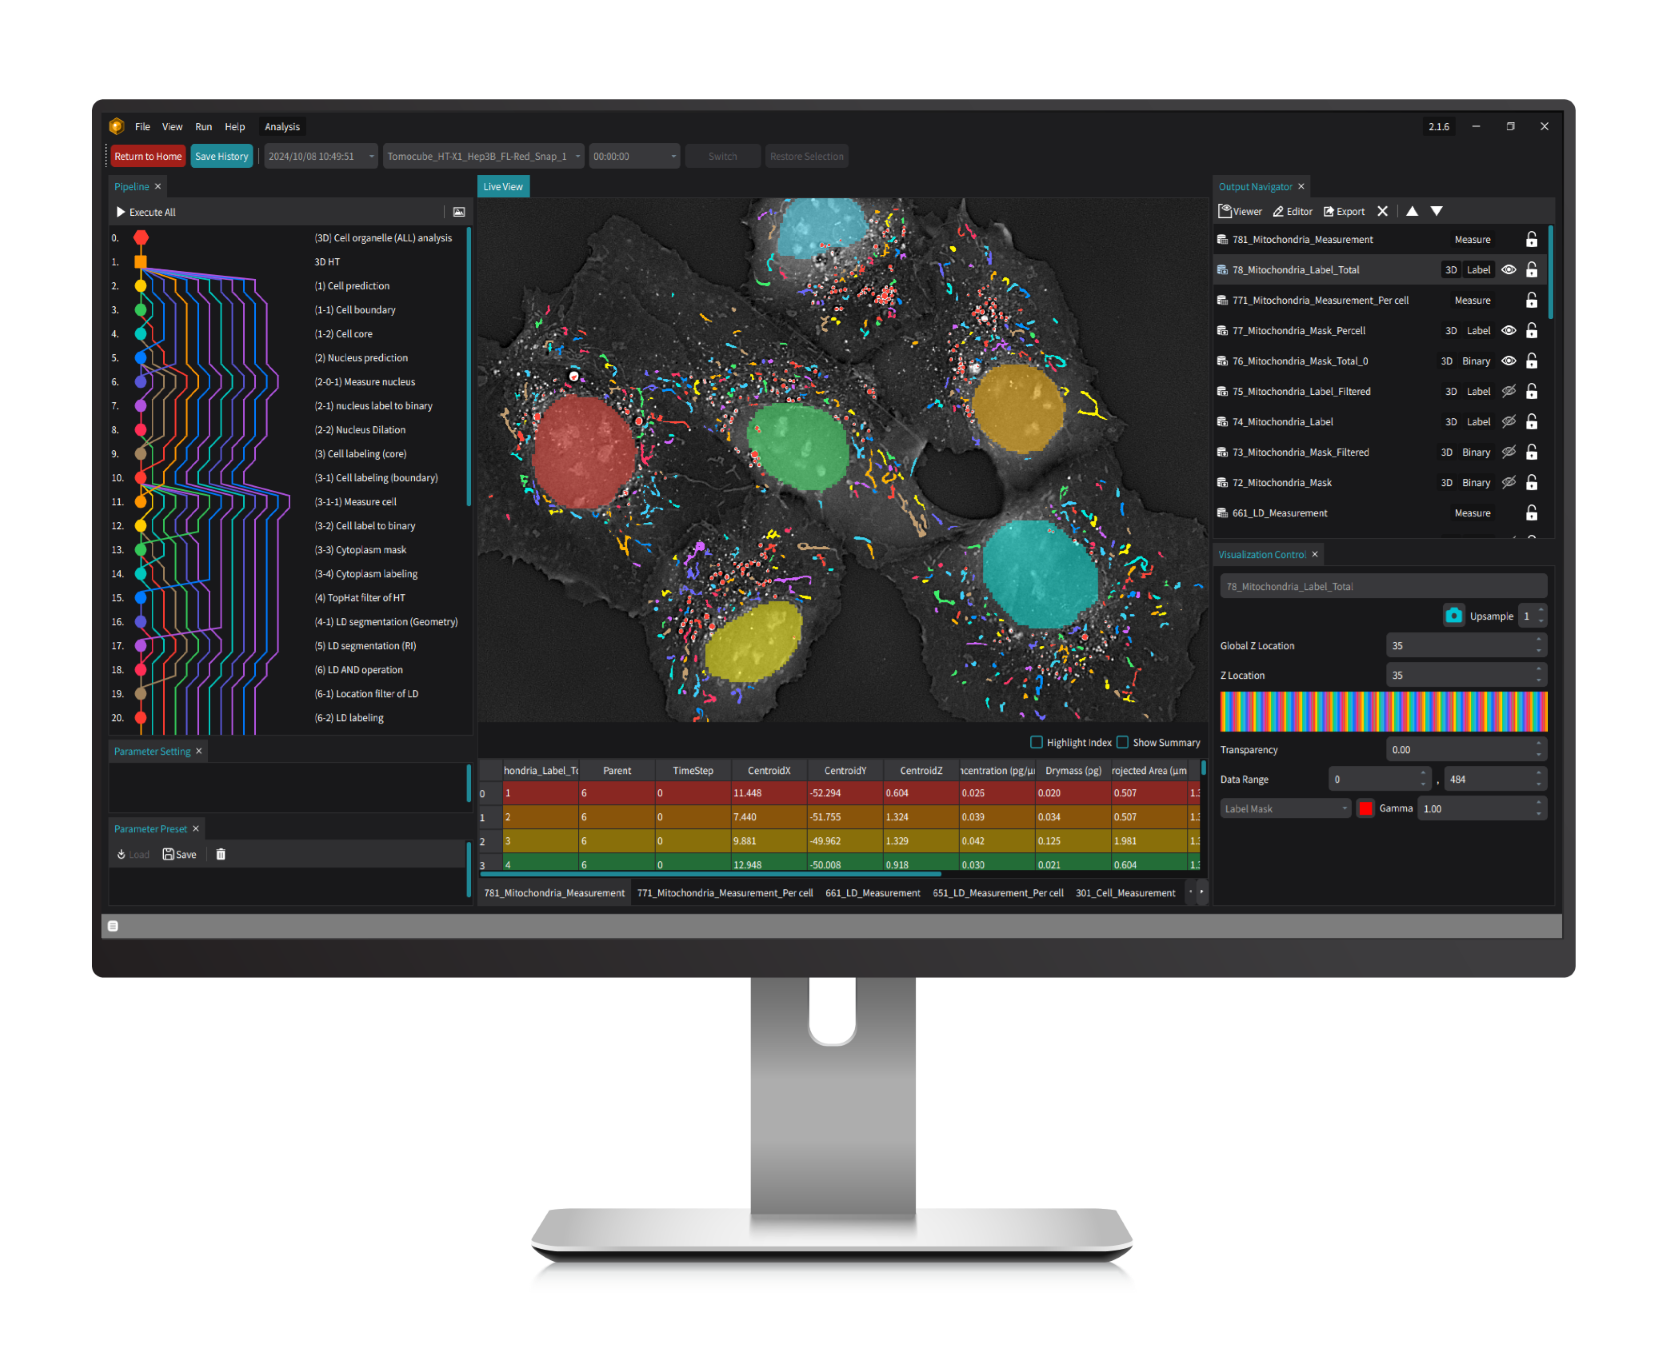
TomoAnalysis 2.0 integrates powerful, open-source artificial intelligence (AI) tools like ilastik, StarDist, and Cellpose, providing a flexible yet rigorous solution for analyzing complex biological images. With fully customizable workflows and efficient batch processing for large datasets, this platform is engineered to meet diverse research needs with scientific accuracy and reliability.
Specially tailored to maximize the capabilities of Tomocube's HT-X1 series, TomoAnalysis 2.0 enables researchers to achieve high-sensitivity, label-free 3D visualization and quantification. It facilitates the precise measurement of morphological and biophysical parameters—volume, surface area, dry mass, and concentration—across various cellular structures such as lipid droplets, mitochondria, organoids, and bacteria, supporting in-depth cellular analysis with clarity and consistency.
Designed for a wide array of applications, TomoAnalysis 2.0 is optimized for both holotomography and correlative fluorescence signals, supporting cell classification and advanced segmentation. This integrated approach empowers researchers to analyze subcellular structural changes, monitor cellular state changes over time, and investigate cluster characteristics under drug treatments, advancing discoveries in cell research through rigorous and adaptable analysis.
Features
-

- AI-driven structure segmentation
- Segmenting cell and subcellular structures with customized AI models.
-
- Refractive index-based thresholding
- Using logical, rule-based image analysis that leverages optical properties.
-

- Manual mask correction
- Fine tuning masks generated by analysis pipelines with Mask Editor’s drawing and label editing tools.
-

- Morphological and quantitative analysis
- Gaining insightful biophysical metrics of segmented objects through AI-powered and RI-based analyses.
-

- 3D visualization
- Gaining comprehensive structural interpretation of the interested objects through the immersive 3D visualization feature.
-

- Fluorescence-integrated analysis
- Studying cellular structures, functions, and processes with high specificity based on fluorescence signal intensity quantification.
Image analysis
-
- Lipid Droplet Quantification
- Lipid droplets (LDs) are essential organelles in lipid storage and energy regulation, making their quantification crucial for understanding cellular health, metabolic processes, and disease mechanisms. TomoAnalysis 2.0 provides an automated, label-free solution for LD analysis in living cells, supporting research across cellular biology and therapeutic studies. TomoAnalysis 2.0 includes a flexible LD analysis pipeline that enables efficient, accurate detection of LDs under standard conditions, as well as a specialized pipeline for tracking dynamic changes in adipocytes, such as those observed during adipogenesis. By leveraging the unique refractive index (RI) properties of LDs, TomoAnalysis 2.0 ensures precise segmentation and quantification of LDs regardless of cell line type, allowing for accurate measurements of key parameters like volume, mean RI, dry mass, and projected area. Researchers can assess LD variations across entire fields of view or conduct detailed single-cell analyses, providing comprehensive insights into lipid distribution and biogenesis. By streamlining these processes, TomoAnalysis 2.0 enhances lipid research, offering a valuable tool for advancing studies in cellular function and disease.
-
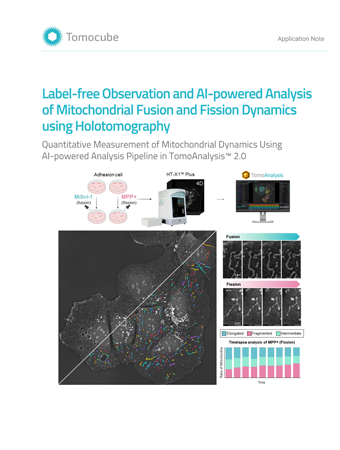
- Mitochondria Size Analysis
- Mitochondria play a critical role in energy production and cellular metabolism, with their size and structural changes acting as vital indicators of cellular health. TomoAnalysis 2.0 offers a powerful solution by providing advanced, automated analysis of high-resolution, label-free 3D live cell images acquired from HT systems. By leveraging the unique refractive index (RI) properties and morphological characteristics of mitochondria, TomoAnalysis 2.0 enables accurate segmentation and quantification without invasive labeling, preserving cell integrity and ensuring reliable data across diverse cell types. The software’s AI-driven segmentation models, which are pre-trained and customizable, allow researchers to tailor models for specific cell lines. This flexibility enables consistent measurement of key parameters, such as volume, surface area, dry mass, and length, directly from 3D tomograms. The ability to adapt models to various cell types makes TomoAnalysis 2.0 versatile for broad research applications. This streamlined, fully automated pipeline not only reduces manual processing time but also significantly enhances research efficiency by delivering high-quality, reproducible data. With its precision and adaptability, TomoAnalysis 2.0 is essential for advancing studies in cellular health, drug development, and metabolic research.
-

- Fluorescence-Assisted Cell Counting and Quantification
- The correlative fluorescence (FL) imaging capability provided by the HT-X1 series perfectly complements the high-resolution, noninvasive HT information by adding molecular specificity. Using FL signals to label specific proteins enables precise localization and quantitative measurement, while RI information provides biophysical insights into individual cells and their subcellular organelles. TomoAnalysis 2.0 enables both conventional FL signal analysis and the creation of FL-based masks to target specific regions of interest. This tool also supports cell and organelle classification derived from FL signal tags, allowing for quantitative measurement and dynamic tracking of these individual cells and subcellular structures. This approach is particularly valuable for monitoring cell proliferation, differentiation, and other key biological phenomena. The synergistic integration of FL signals with HT data enhances the depth and precision of cellular analysis, allowing segmentation and analysis of areas that are difficult to distinguish through RI differences alone.
-

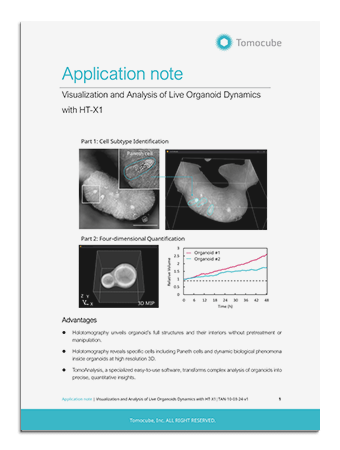
- Organoid Growth and Morphology Assessment
- Research on organoids - 3D miniaturized versions of organs and tissues derived from cells - benefits significantly from the detailed and noninvasive imaging capabilities of HT imaging. Monitoring organoid growth is essential for ensuring that they closely replicate the structures and functions of real organs. TomoAnalysis 2.0 utilizes RI values and a rule-based segmentation process to analyze the organoid growth within its 3D matrix like Matrigel, providing detailed measurement of volume, area, and concentration. For cystic organoids, it enables comprehensive 3D analysis, allowing researchers to examine either the entire structure or isolate the lumen for focused analysis of the cell layer. This capability supports organoid counting and detailed assessment of structural changes over time, offering valuable insights into early-stage growth and overall condition. Together, these features ensure effective quality control throughout the organoid development process.
-
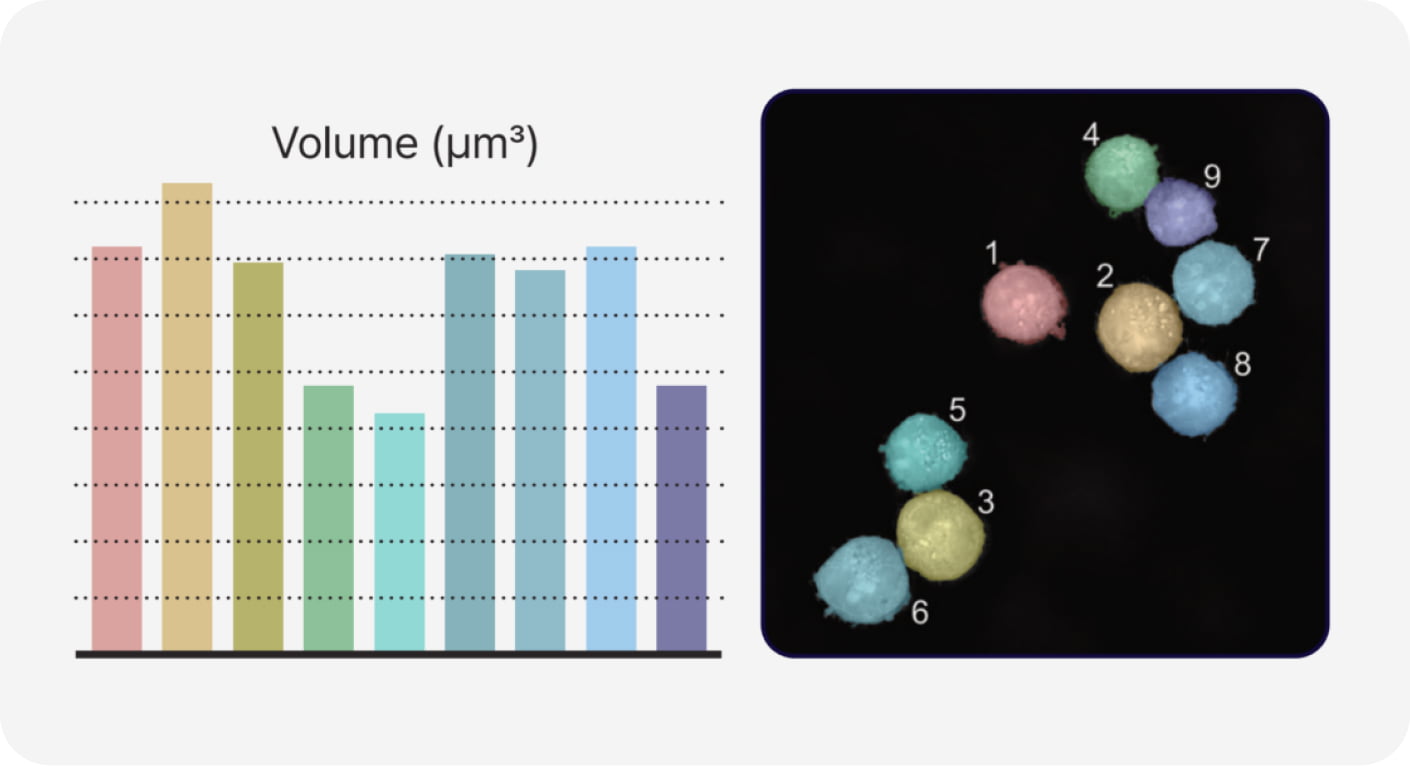
- Single Cell Analysis
- The segmentation of cells is a fundamental step in many cell-based biomedical studies due to its pivotal role in extracting meaningful information from complex biological images. TomoAnalysis 2.0 offers a streamlined workflow that combines AI-driven segmentation, refractive index thresholding, and image processing algorithms to enable accurate and quick 3D cell segmentation. This process allows researchers to automatically perform batch analysis and quantify key cellular features such as size, volume, concentration, and spatial distribution at the single-cell level, providing deeper insights into cellular morphology. Additionally, the versatile workflow can be used to analyze cellular dynamics, migration, and differentiation over time.